Temi A. Ogunyoku, PhD

Transforming Data Assessment Tools to Operate at Scale

I led the redesign of a fragmented data management system and user interface for population-based child assessment tools, streamlining operations and enhancing usability. These improvements enabled the tools to be effectively used in South Africa's largest national survey of children's learning outcomes. My insights and strategic recommendations achieved a 185% reduction in data processing time for the assessment tools, facilitating data-driven decision-making.

Organizations

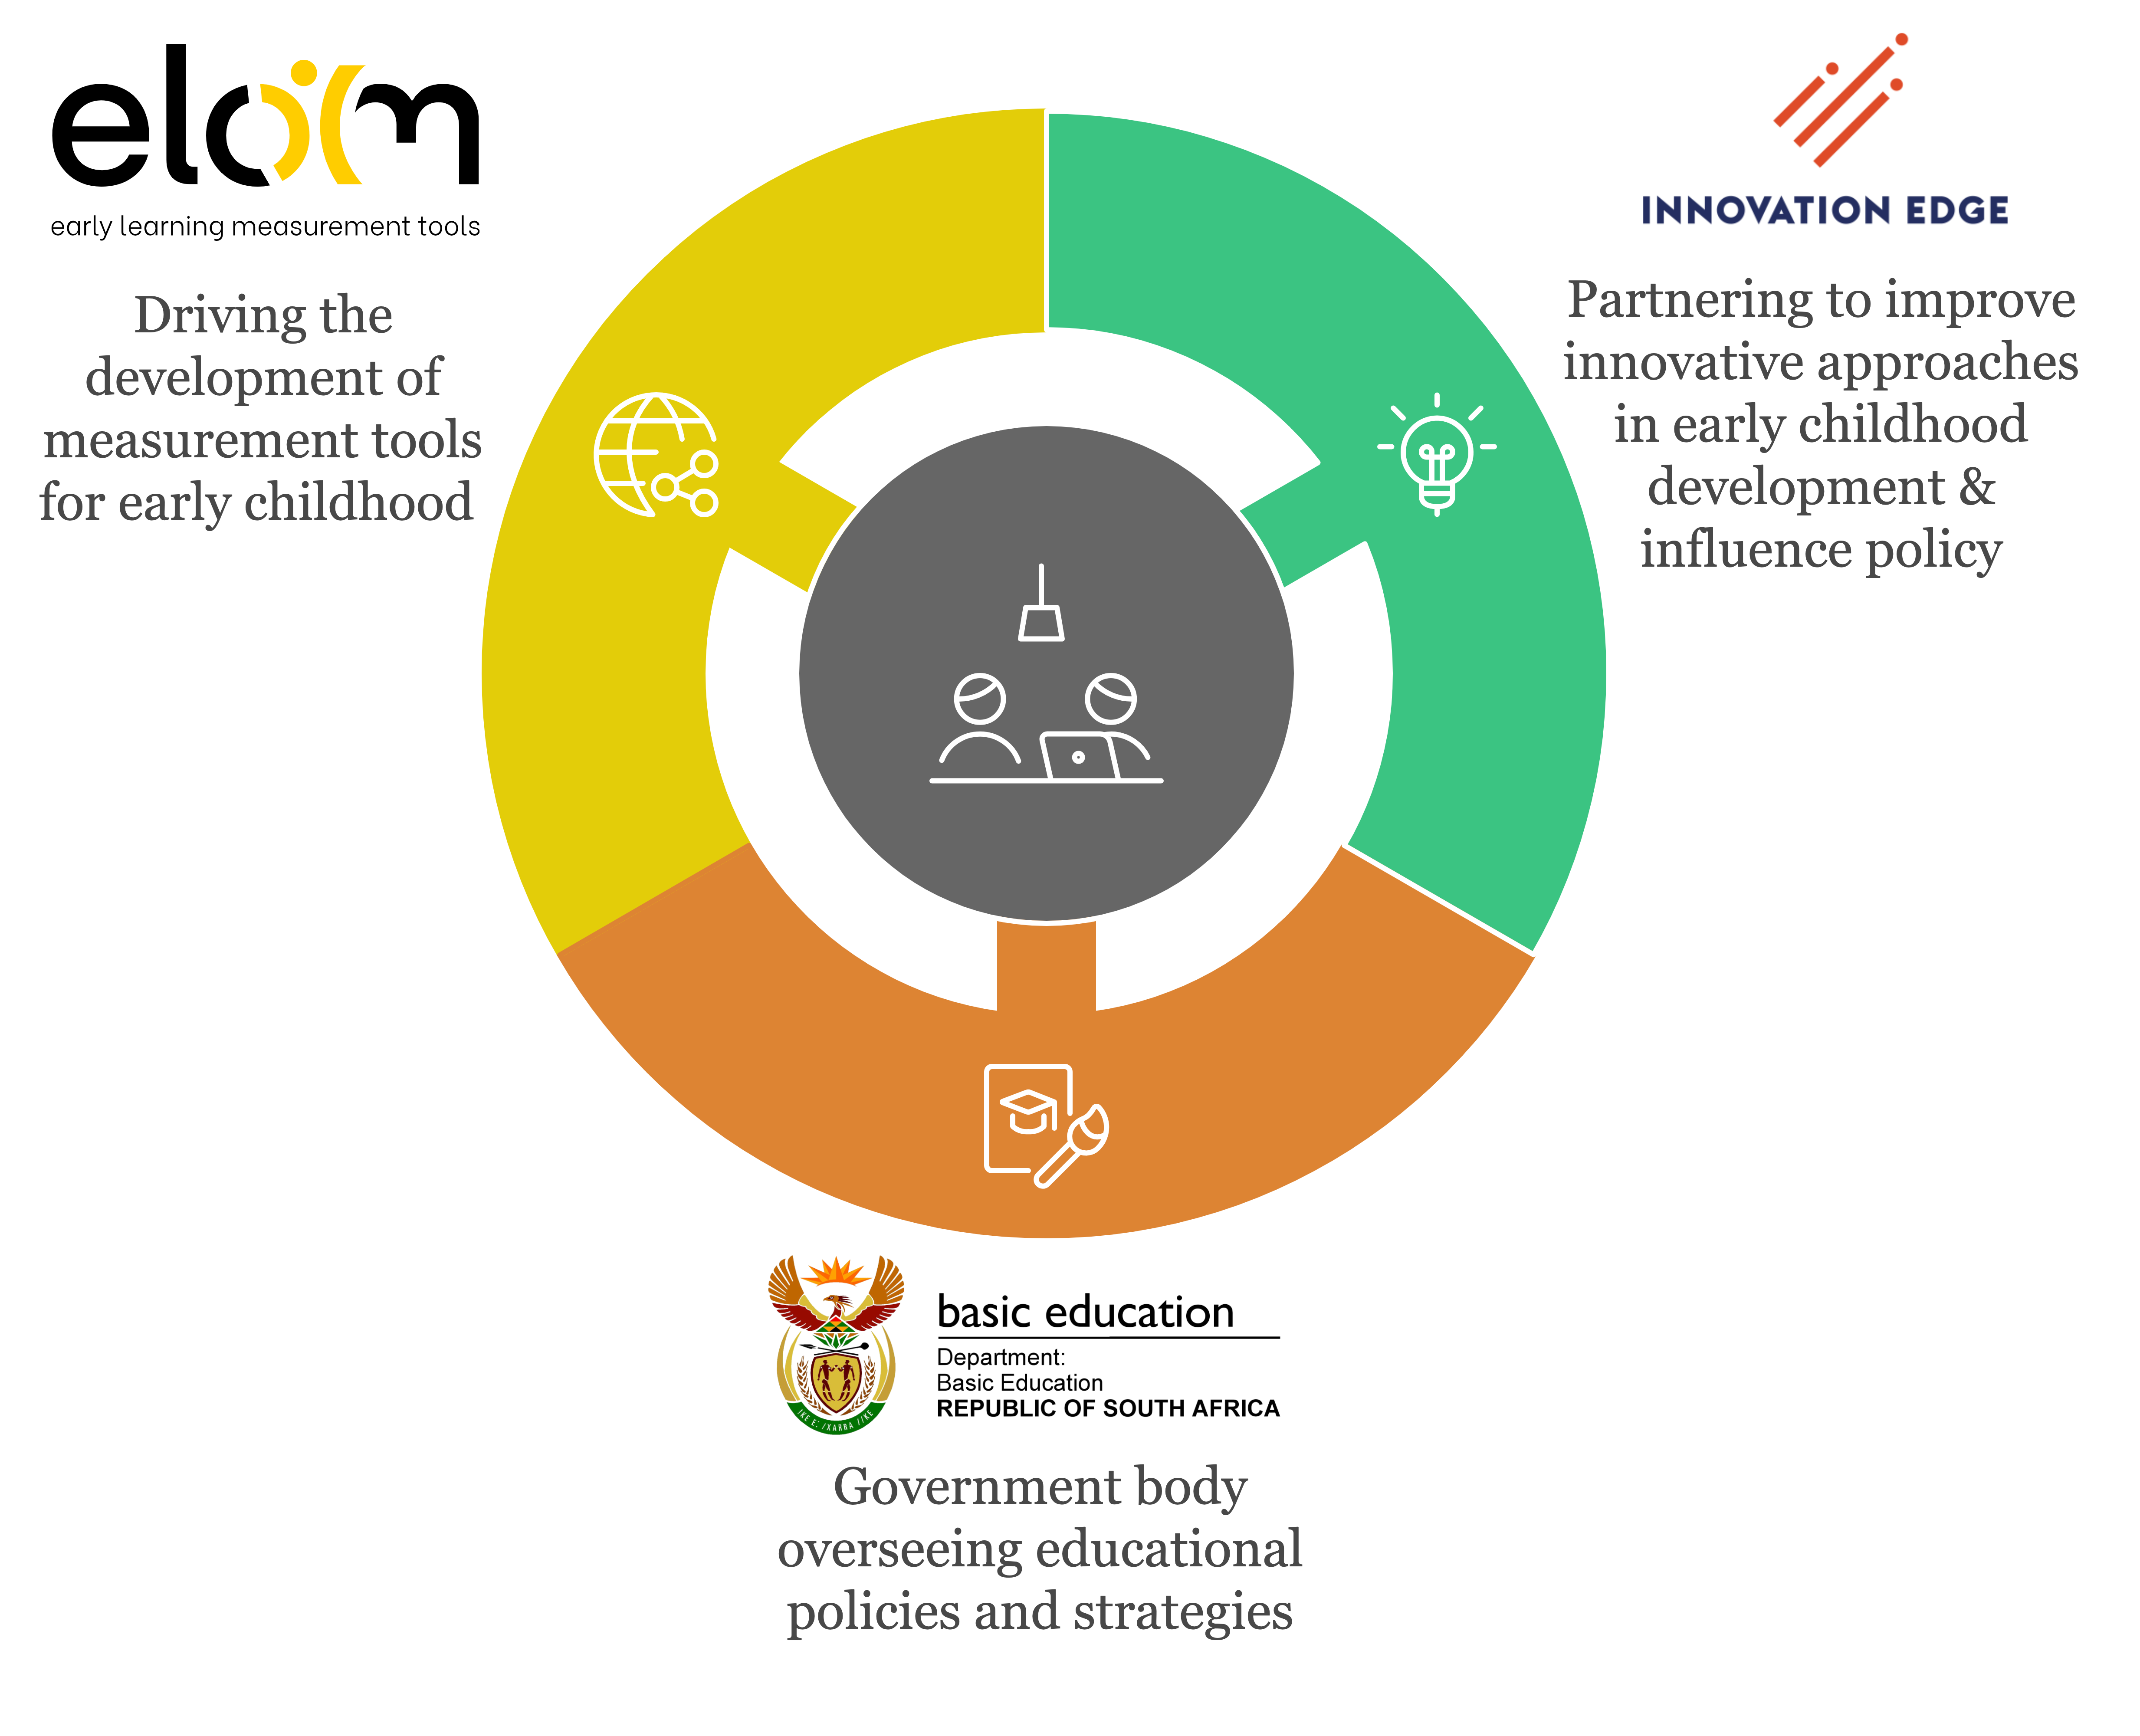
Early Learning Outcome Measurement (ELOM), now part of Data Drive 2030 and Innovation Edge

Role

Head of Data Strategy & Lead UX Researcher

Timeline

8 months

Scope

Data Strategy, System Design, Discovery & Evaluative Research

About the project

The Early Learning Outcome Measurement (ELOM) team developed population-based child assessment tools to evaluate whether children are developmentally on track for their age. These tools effectively measure a range of developmental outcomes in young children and provide critical insights into the quality of early learning environments in both home and program settings.

Innovation Edge, an impact-driven investor focused on early childhood challenges, partnered with ELOM to fund and support the development and implementation of these tools. Beyond their investment, Innovation Edge played a critical role in integrating ELOM’s assessments into the Thrive by Five Index—a multi-sectoral initiative led by the Department of Basic Education. This national survey leverages ELOM’s tools to deliver critical insights into early learning outcomes, directly informing evidence-based policy and long-term program design.

I collaborated with ELOM to implement a centralized, scalable data strategy, optimizing their data management system and user interface to enhance data accuracy and user experience. These improvements were critical to the successful execution of the Thrive by Five survey and its role in shaping long-term national strategies for early childhood development.

ELOM

The Problem

ELOM’s data management system was fragmented, with multiple servers and disconnected tools creating inefficiencies in form creation, data entry, and storage. This lack of centralization led to:


  • Delayed Processes: Fragmented workflows hindered real-time monitoring and slowed data cleaning.
  • Data Security Risks: Disjointed systems raised concerns about breaches and data loss.
  • Limited Scalability: The inefficiencies constrained productivity and scalability, complicating efforts to support initiatives like the Thrive by Five survey.

These challenges jeopardized ELOM’s ability to deliver reliable, high-quality data, impacting their mission to improve early childhood outcomes and inform evidence-based policy.

Research and Strategic Goals

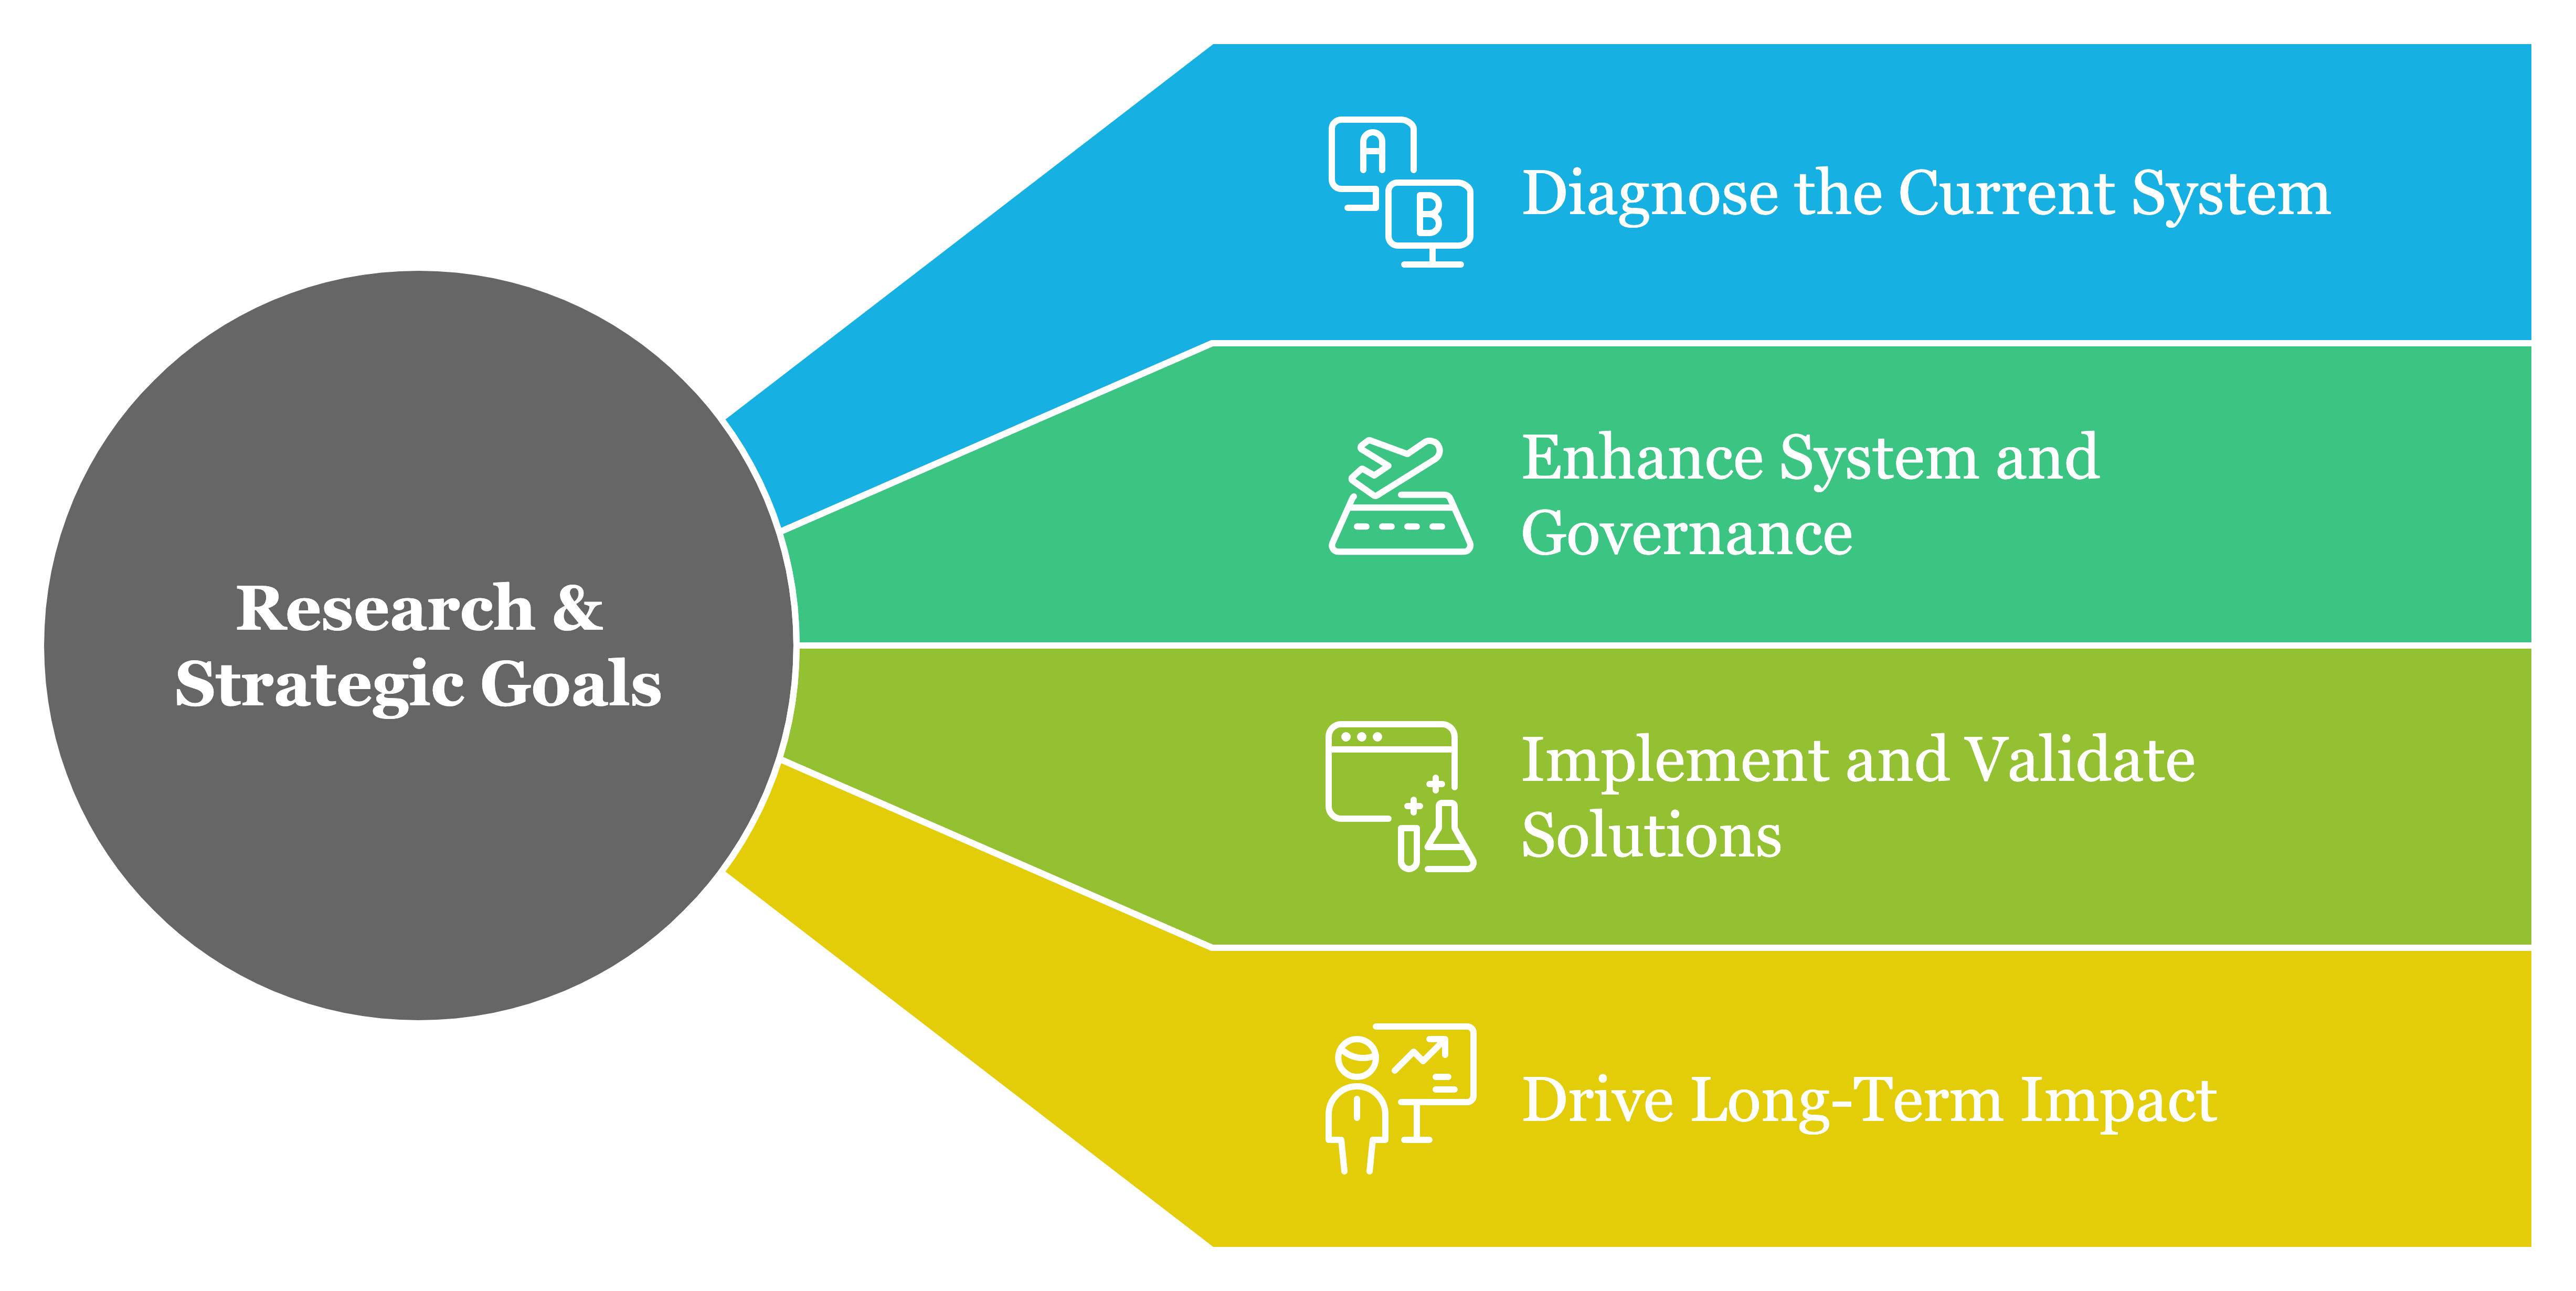
To address the challenges of a fragmented data management system and support ELOM’s mission to evaluate developmental outcomes and influence policy, the following goals were established:

ELOM Research Goals

1. Diagnose the Current System

  • Evaluate the Data Lifecycle: Analyze the entire data value chain—from collection to analysis—to identify inefficiencies, refine processes, and pinpoint opportunities for improvement.
  • Identify User Pain Points: Gather insights from key stakeholders, including funders, field assessors, data analysts, project managers, ECD experts, and decision-makers in early learning programs and initiatives. This research aimed to uncover frustrations, gaps, and unmet needs in the existing system.

2. Enhance System and Governance

  • System and Governance Improvements: Design targeted improvements in data and project management processes while establishing a data governance framework aligned with South Africa’s Protection of Personal Information Act (POPIA).
  • Develop Onboarding and Decision Processes: Create a centralized repository for assessment requests to streamline decision-making and ensure projects align with ELOM’s strategic priorities.

3. Implement and Validate Solutions

  • Iterative Testing with Stakeholders: Design and test solutions collaboratively with stakeholders to ensure updates meet user needs and compliance standards.
  • Develop a Scalable System: Build an integrated system capable of handling multiple concurrent assessments while enhancing the capabilities of ELOM’s tools.

4. Drive Long-Term Impact

  • Enable Impact Tracking and Policy Influence: Develop scalable systems and teams to measure developmental outcomes, supporting Innovation Edge, the Department of Basic Education, early learning programs, and related initiatives. These systems ensured that investments and programs could track their impact effectively and shape education policy and program design through robust, data-driven insights.

What I Did

I led a multi-disciplinary effort to redesign the data management system, UI, and onboarding processes for ELOM’s assessment tools. My approach prioritized scalability, efficiency, and data quality, leveraging a deep understanding of the needs and constraints of diverse stakeholders. The work spanned two critical phases: Discovery & Strategy and Design & Implementation, ensuring solutions were both stakeholder-driven and operationally feasible.

Phase 1: Discovery & Strategy In this phase, I focused on understanding the existing challenges, aligning stakeholders, and developing a strategic roadmap for redesigning ELOM's data management system and tools:


ELOM phase 1
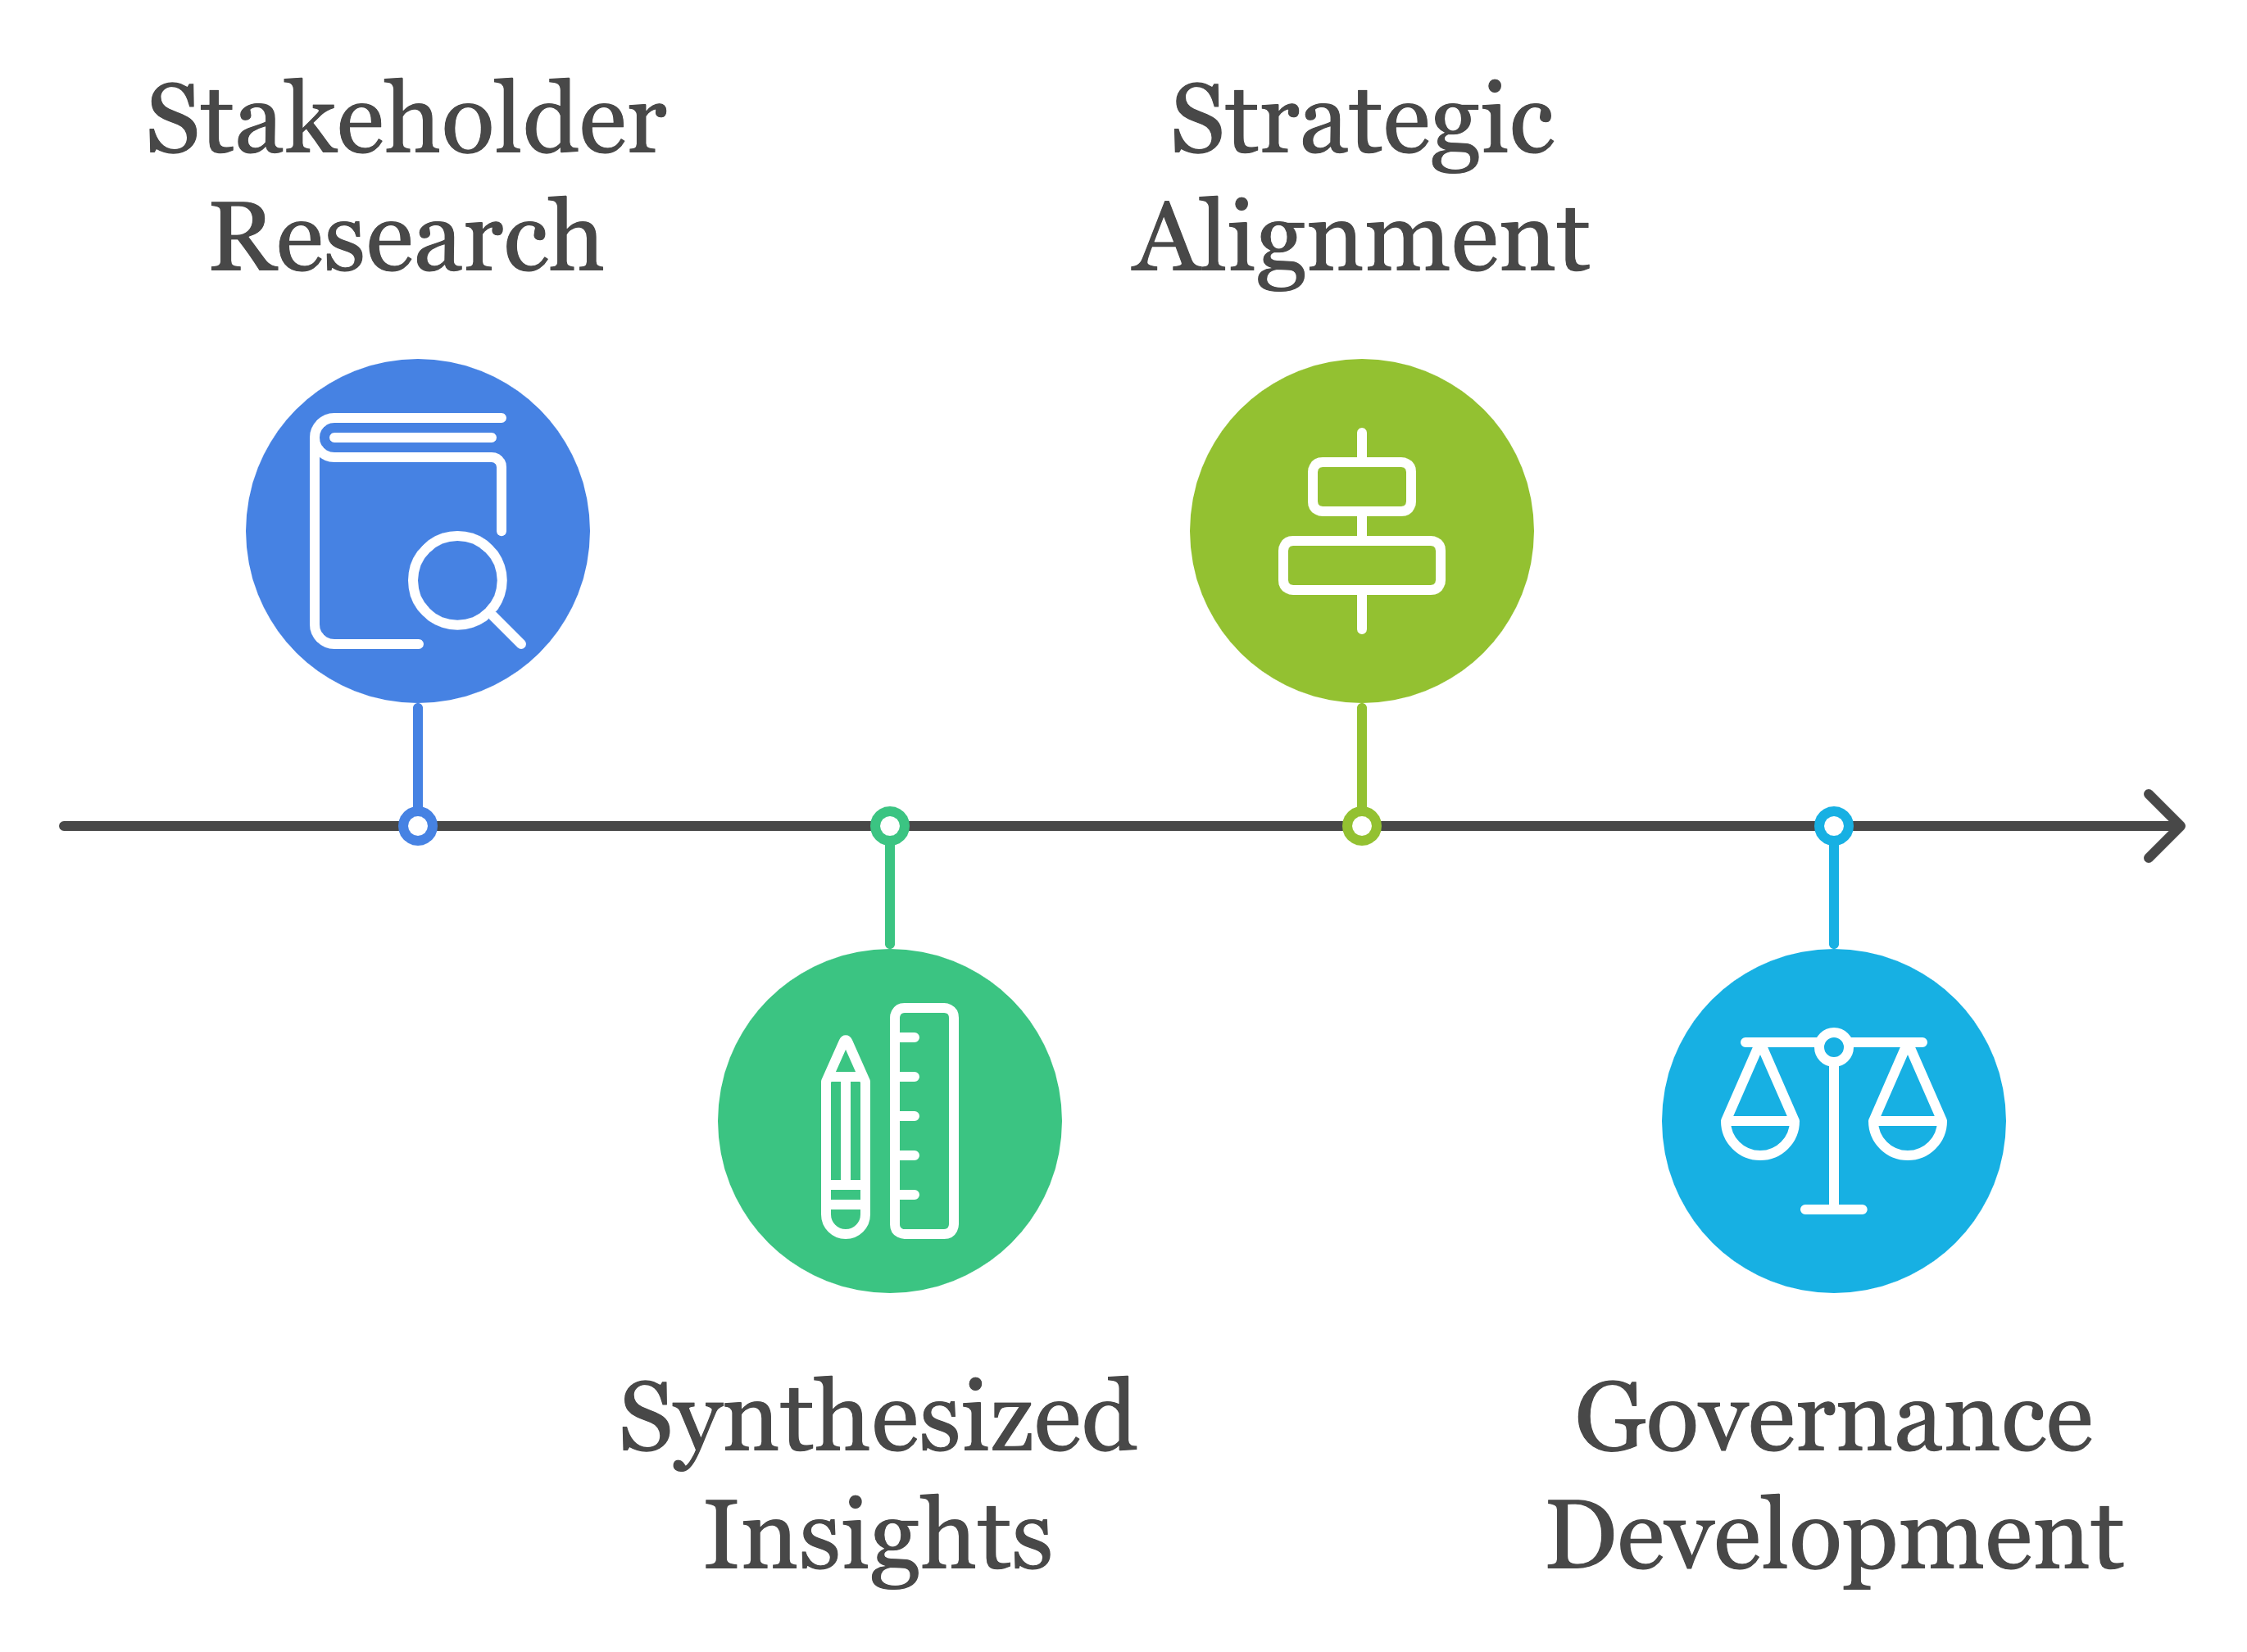
  • Stakeholder Research: Conducted in-depth interviews, workflow analyses, and tool evaluations to uncover critical pain points across the data lifecycle for key user groups, including field assessors, data analysts, and decision-makers. This research uncovered critical challenges for different user groups ensuring that our solutions were grounded in real-world needs rather than assumptions.

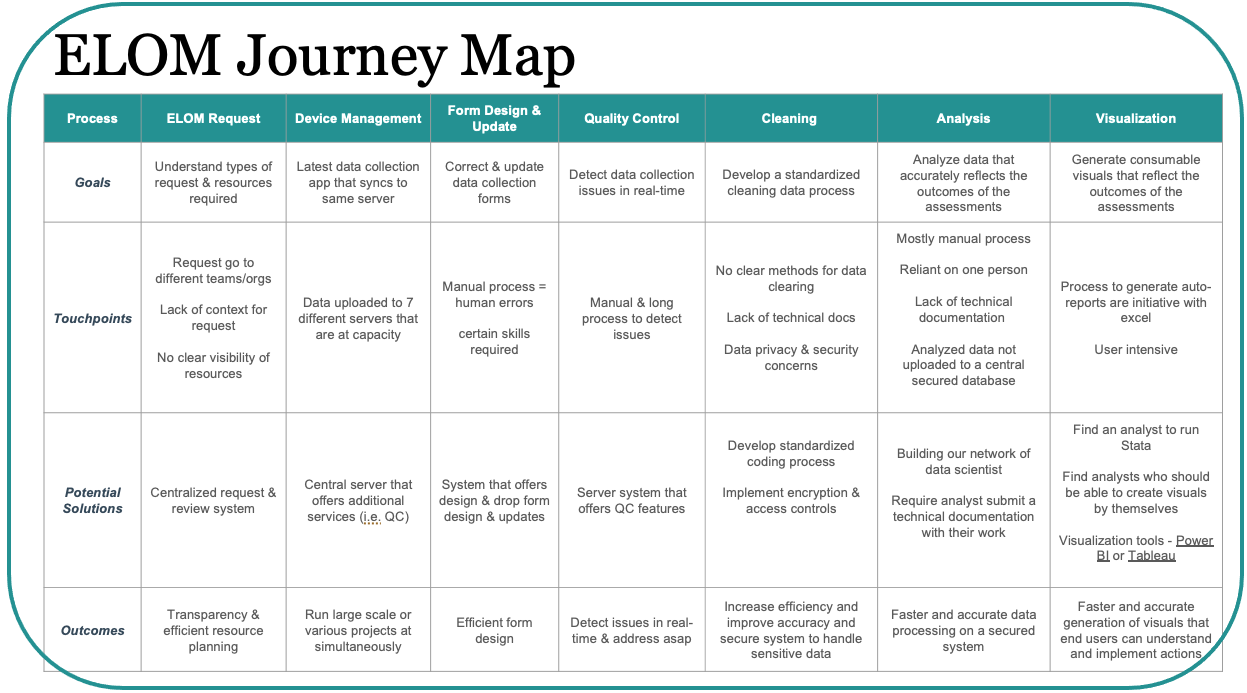
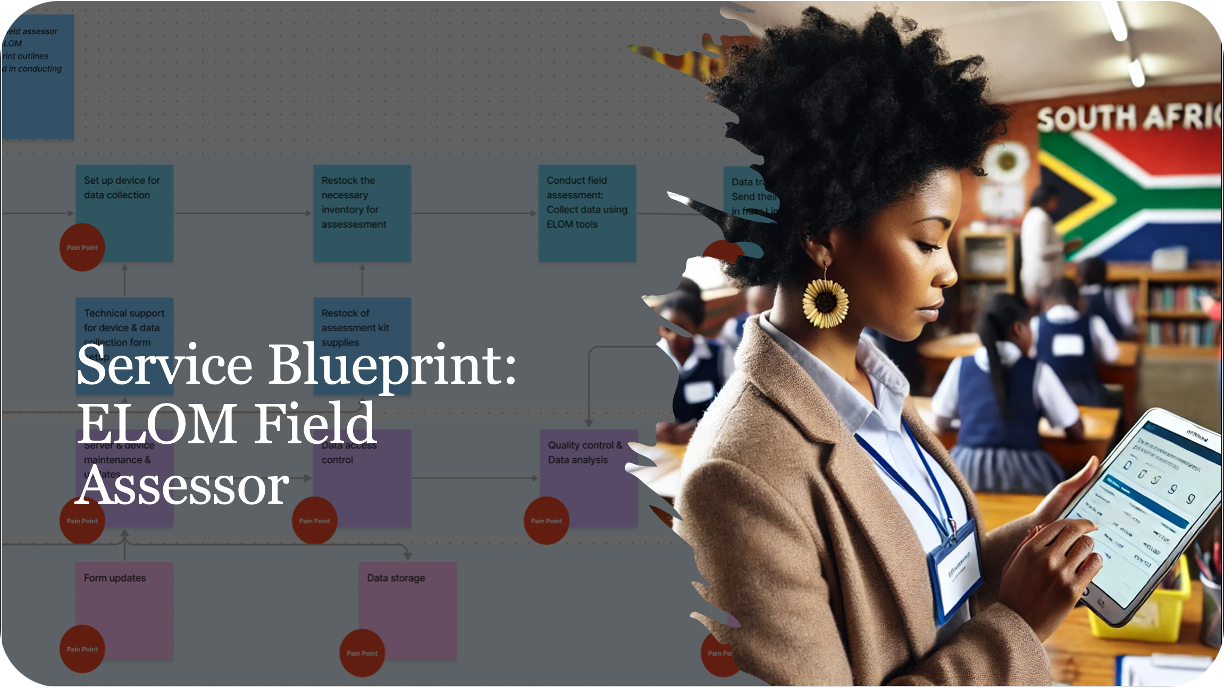
  • Synthesized Insights: Created personas, journey maps, and service blueprints to visualize user needs and interactions, identifying high-impact areas for improvement, including data centralization, quality control, and security. These artifacts helped align stakeholders around system improvements and provided a clear roadmap for the redesign.


ELOM Journey Map
 
ELOM Blueprint
  • Strategic Alignment: Facilitated cross-functional workshops to generate practical solutions, build stakeholder buy-in, and establish a roadmap for system improvements. This collaborative process ensured the feasibility and scalability of proposed solutions.

  • Governance Development: Introduced a data governance framework aligned with South Africa’s Protection of Personal Information Act (POPIA) to ensure compliance and enhance trust in the system.

Phase 2: Design & Implementation Building on the strategy, this phase focused on designing, testing, and deploying scalable solutions to address identified challenges:


ELOM phase 2
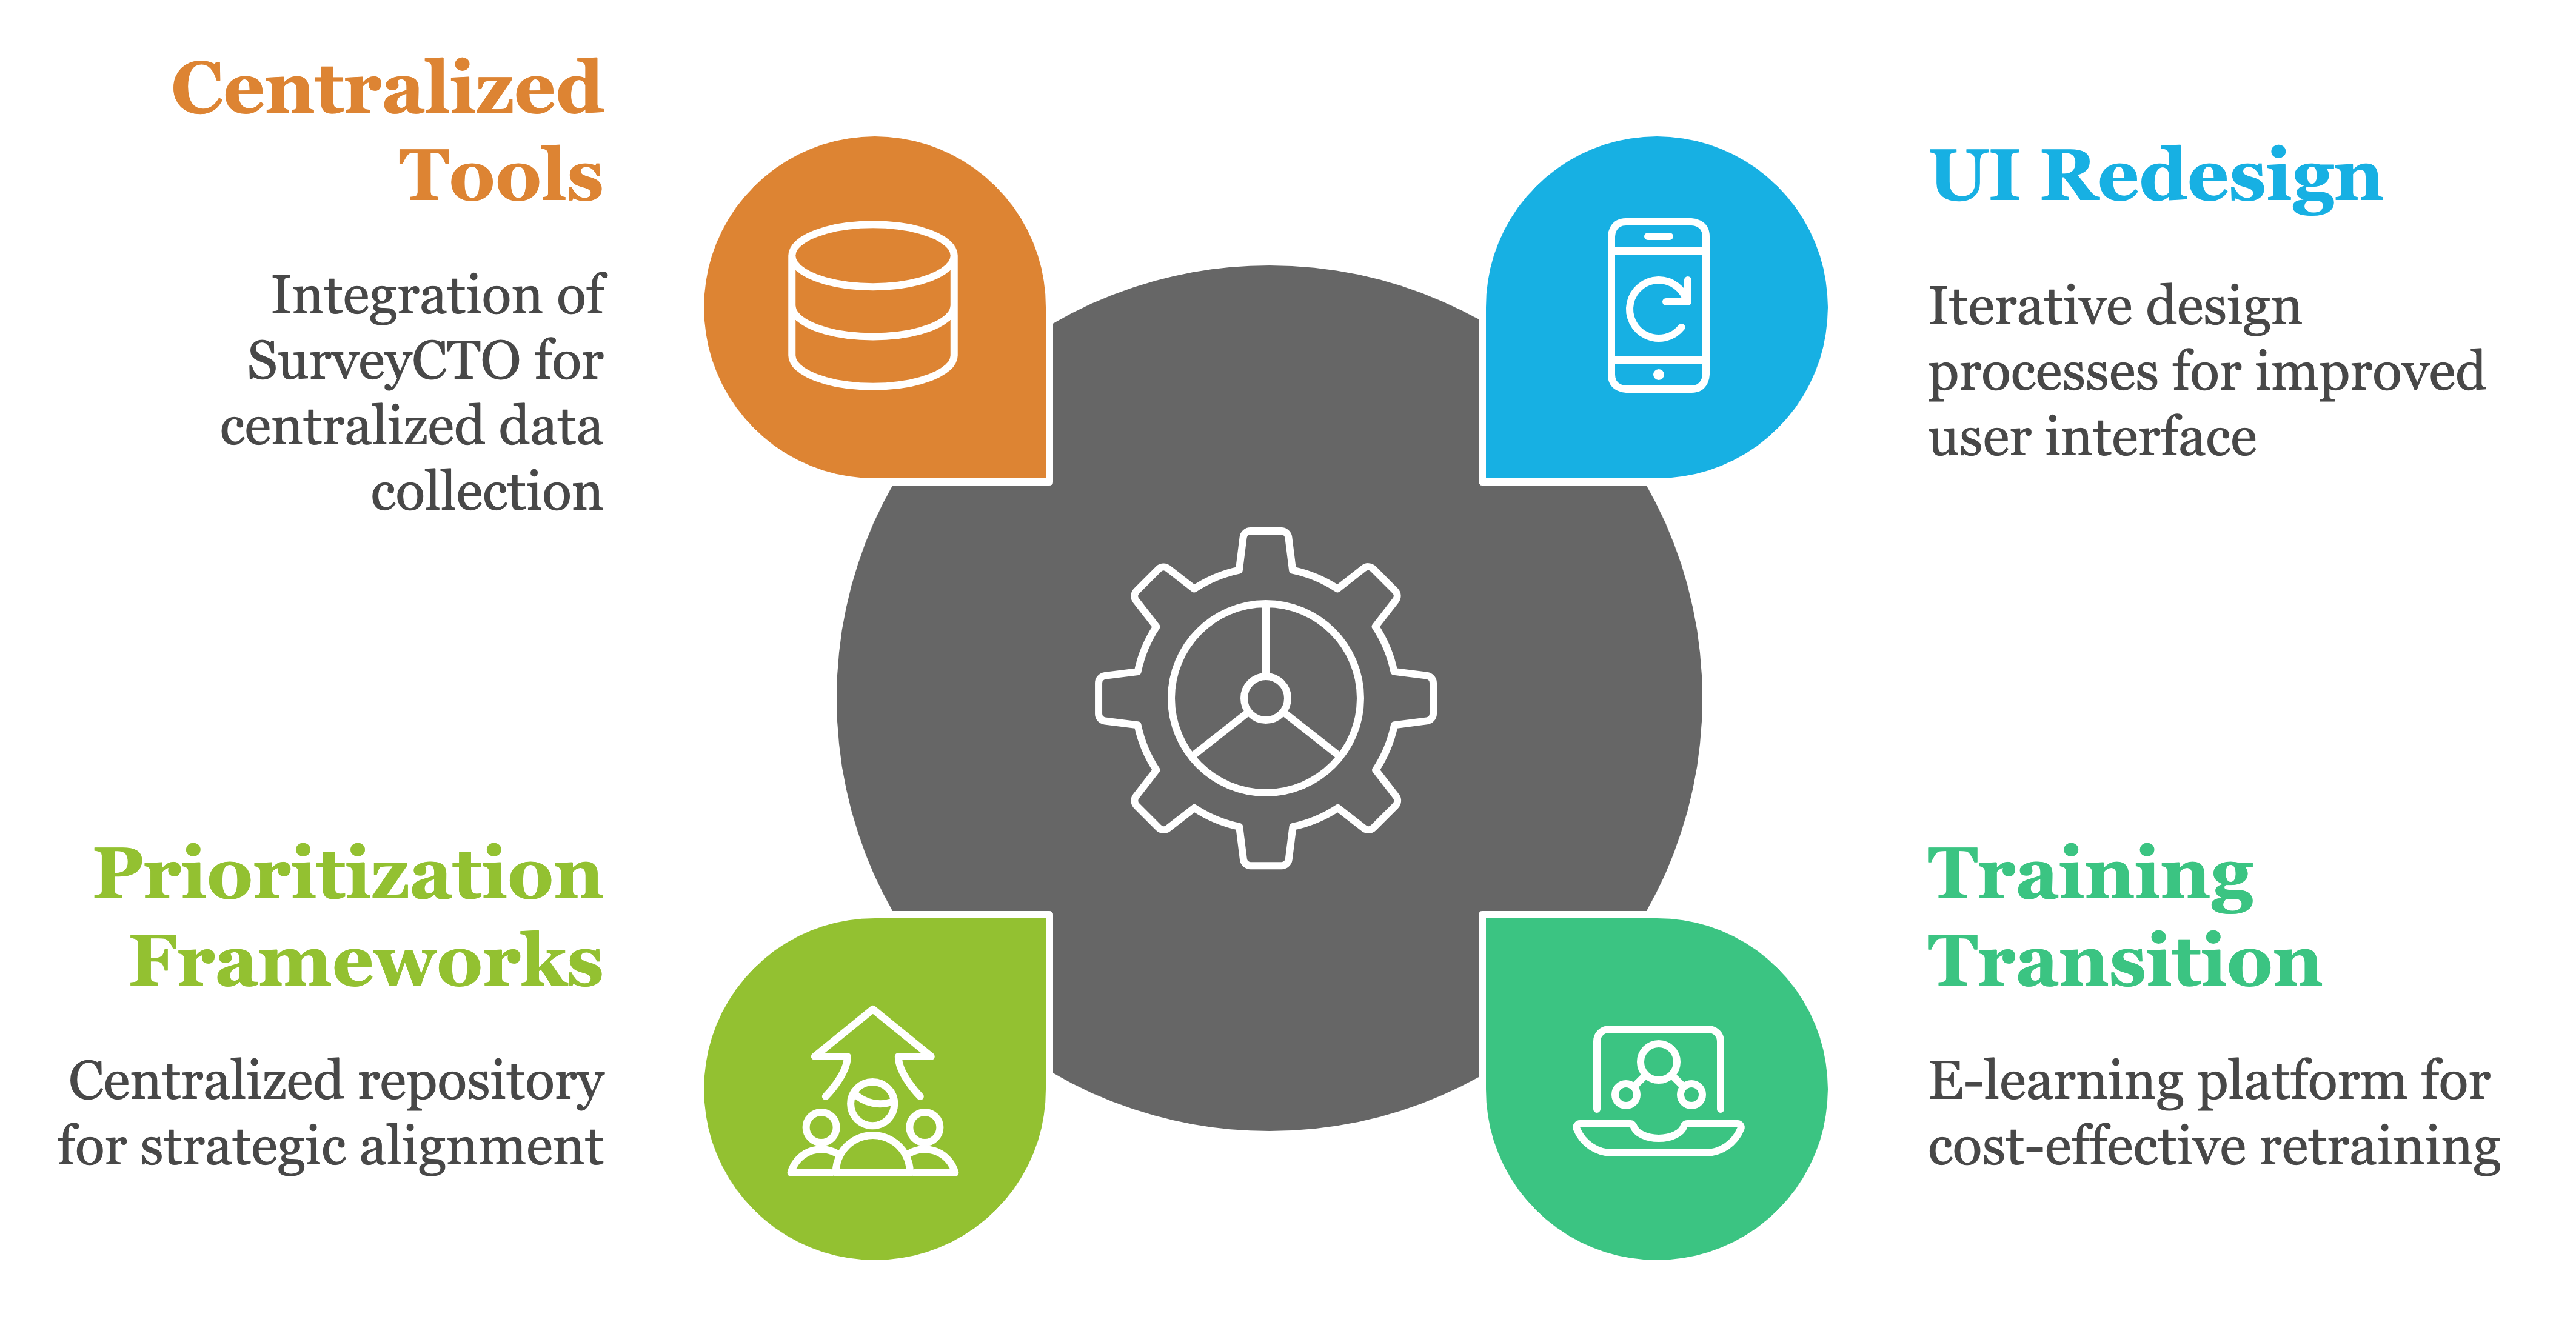
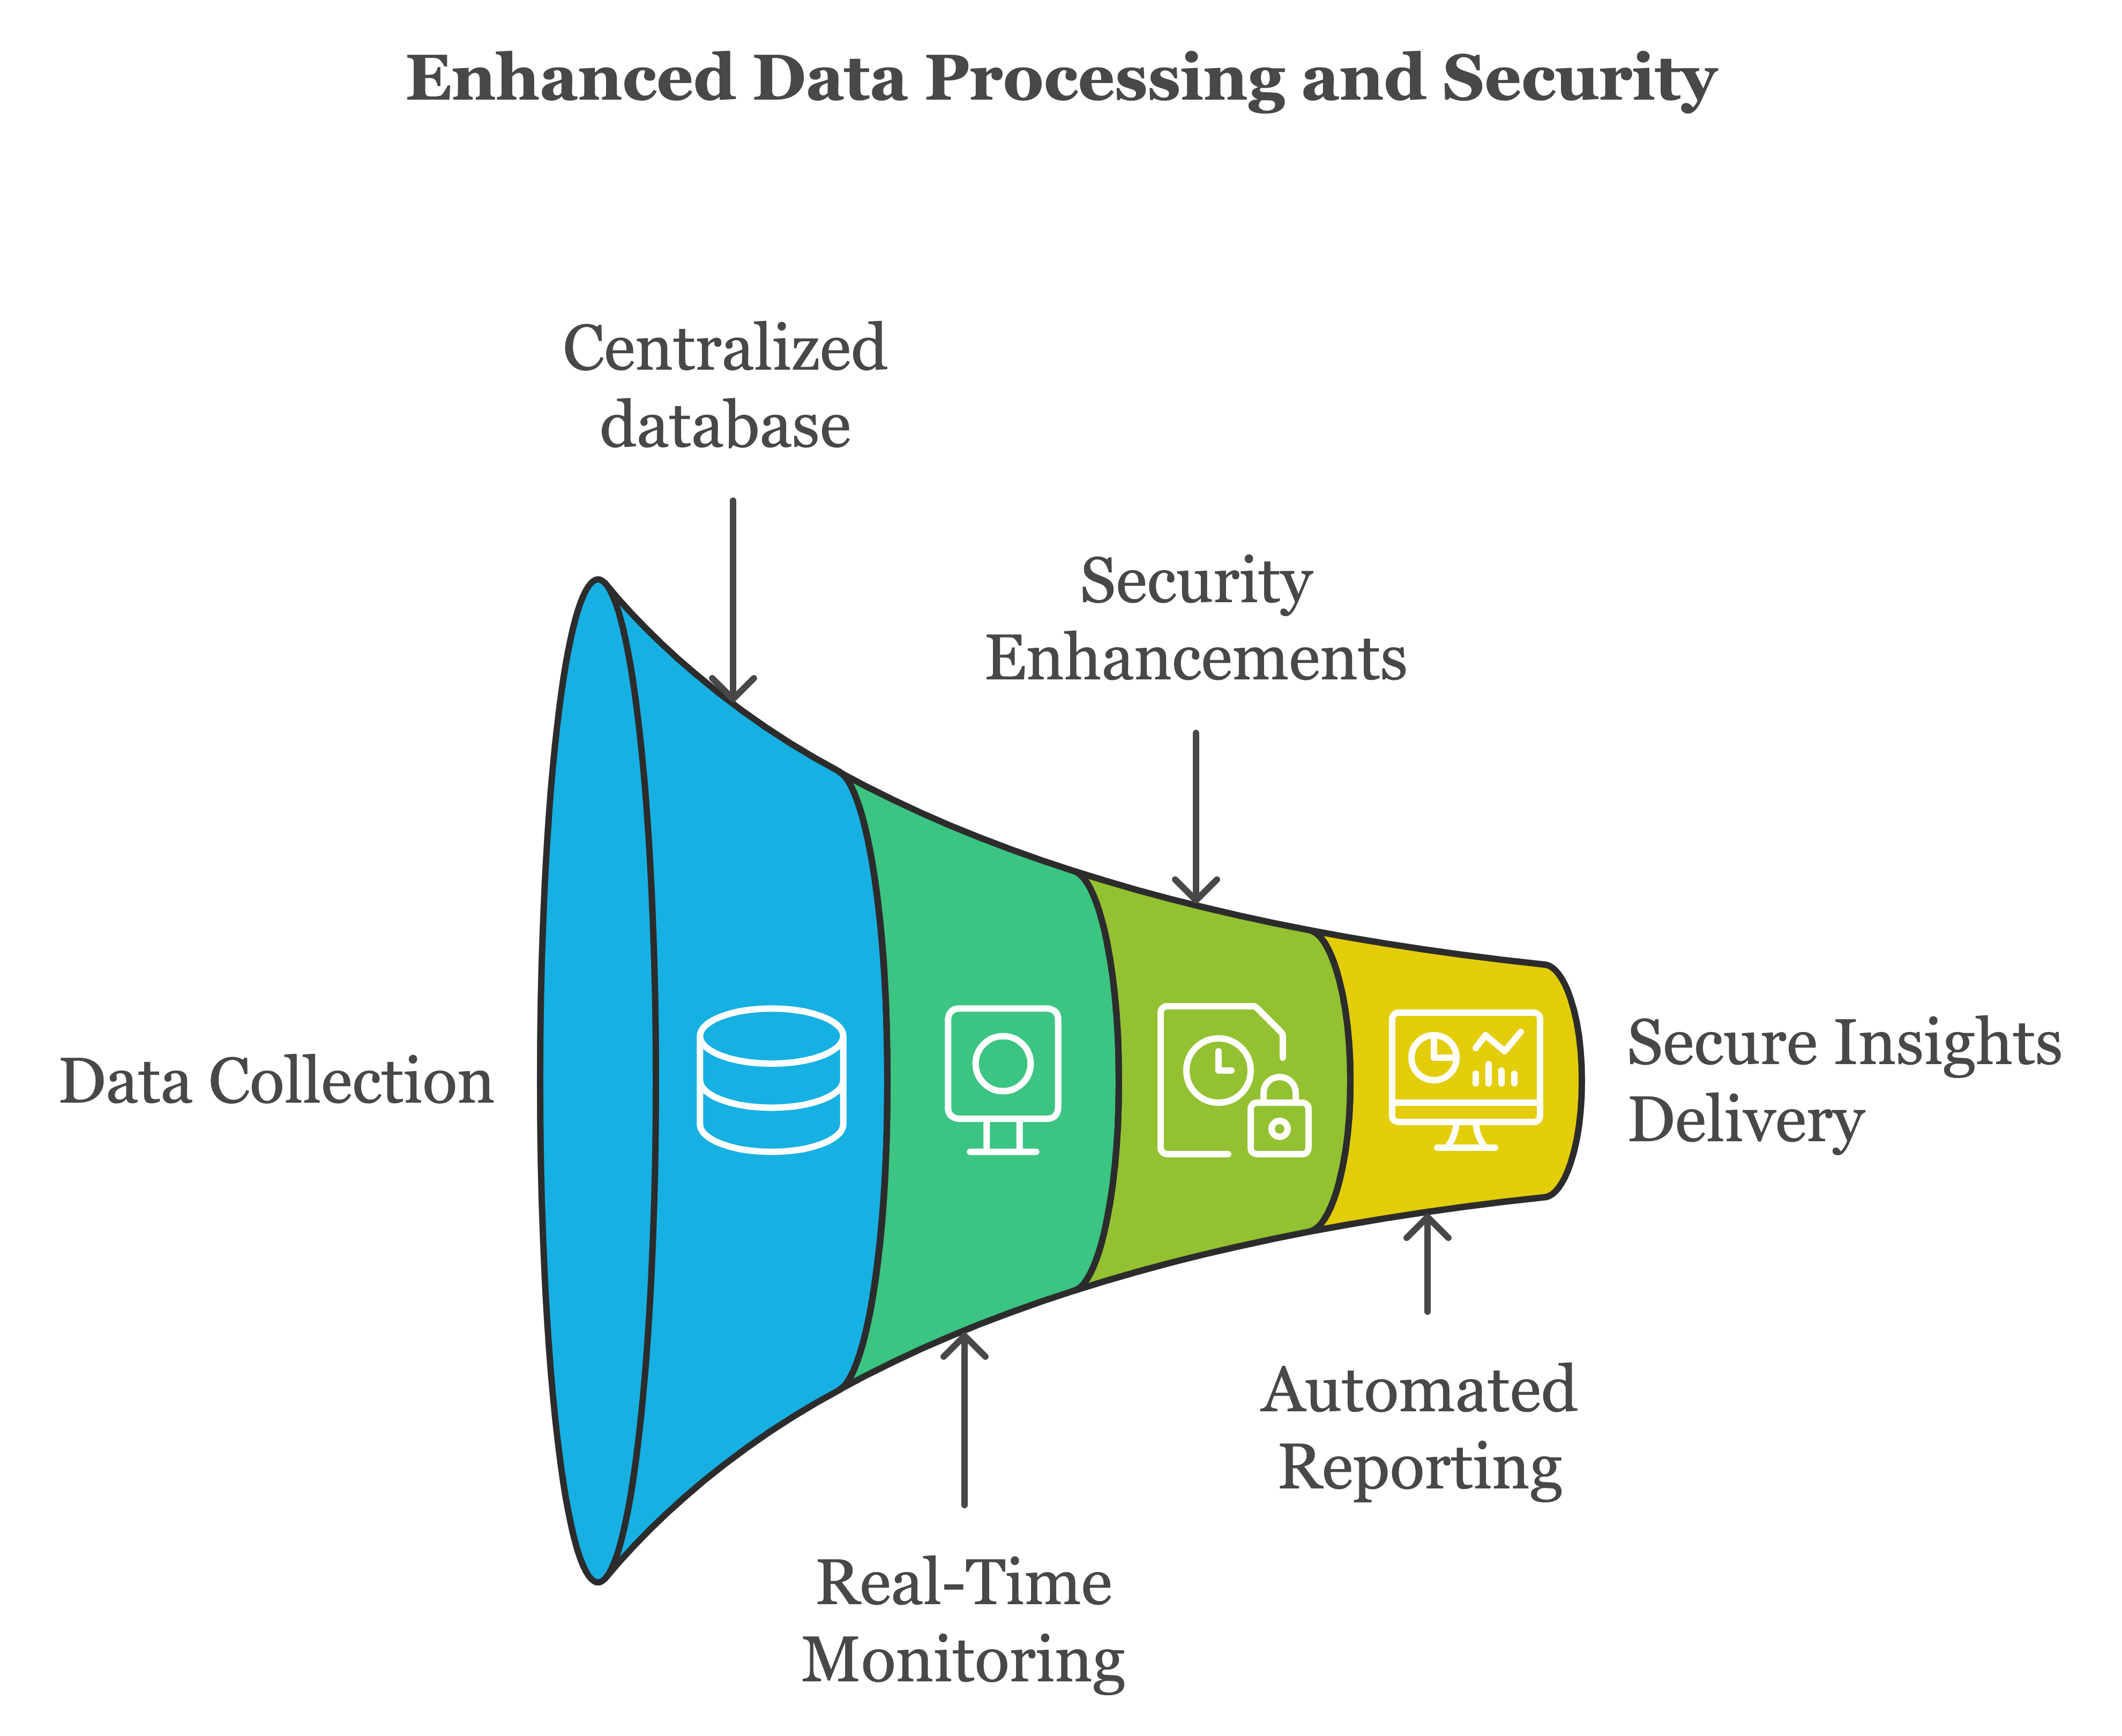
  • Centralized Tools and Monitoring: Partnered with a service provider to integrate SurveyCTO, centralizing data collection and leveraging built-in features such as real-time monitoring, device management, and encryption to enhance workflow efficiency and security. Centralization and monitoring supported scalability for high data volumes across varied field conditions.

  • UI and System Redesign: Led iterative design processes, incorporating usability testing to refine the system interface, improve data entry accuracy, and enhance user experience for diverse workflows. Feedback from these sessions was instrumental in adapting the system for diverse environments and workflows.

  • Training and Onboarding: Partnered with a service provider to transition field assessor training to an e-learning platform. This scalable approach ensured that the workforce stayed current with the latest assessment requirements, supporting consistent, high-quality assessments across regions.

  • Prioritization Frameworks: Developed a centralized repository for assessment requests and a weighted decision matrix to align projects with strategic goals and optimize resource allocation. This structured onboarding process enabled ELOM and Innovation Edge to allocate resources effectively, align projects with organizational priorities, and better track investment impact.
Insights & Recommendations

System Efficiency

  • Fragmented Workflows: Seven servers and four disconnected tools caused delays in data cleaning and analysis.
  • Manual Errors & Security Risks: Manual data transfers led to errors and risked exposing personally identifiable information (PII).
  • Recommended Solution: Implement a centralized system (e.g. Ona, SurveyCTO, Open Data Kit) for data collection form creation, and data storage to streamline workflows, enable real-time monitoring, and ensure compliance with privacy regulations.

Data Quality

  • Collection Errors: Data entry errors, along with inconsistencies in how field assessors interpreted instructions or assessed children’s activities, disrupted downstream analysis and affected the reliability of results.
  • Recommended Solutions: Implement a real-time monitoring to flag data entry issues and ensure greater accuracy during the collection process. Improve user interfaces with simplified workflows and intuitive design elements to reduce data entry errors and enhance usability.

Capacity Building

  • Limitation of Field Assessor Training: Field assessors, spread across the country, required regular retraining to stay up to date with credentials and conduct assessments. In-person sessions were expensive, time-consuming, and limited in frequency, as they required a minimum number of participants to justify costs.
  • Recommended Solution: Explore a cost-effective method for field retraining, such as an online or hybrid solution, to address workforce demands and maintain consistency.
  • Inefficient Data Form Management: The ELOM technical and operational team faced challenges in designing data collection forms due to limited access and complexity. Only one analyst could create forms, and this bottleneck delayed projects.
  • Recommended Solution: Create clear documentation and train ELOM team to create forms on exisiting system or implement a system with simplified form design and multi-user access to streamline workflows, enable quality assurance, and empower the team to contribute more effectively.

Data Visualization

  • Manual Reporting Process: The method of generating ELOM reports was manual and labor-intensive, relying on Excel for data manipulation and visualization. The sole ELOM data analyst must manually input data, sort variables, and ensure correct placement, leading to potential errors, time-consuming efforts, and delayed outputs.
  • Recommended Solution: Expand access to visualization tools (e.g. Power BI and Tableau) and automate reporting processes.

Project Management & Processes

  • Inefficient Coordination: The lack of formal tools and workflows led to inefficiencies in task and resource management, resulting in delays and suboptimal allocation.
  • Recommended Solution: Introduce an integrated project management tool to improve collaboration and streamline workflows. Additionally, implement a decision-making framework to provide structured methodologies for selecting and funding ELOM assessments for organizations.
  • Informal Processes: The ELOM operations team worked without standardized workflows or clear processes, resulting in inconsistent task execution and gaps in data management practices.
  • Recommended Solutions: Develop and implement consistent workflows (e.g., a process for providing feedback to field assessors on the quality of assessments) and operational guidelines (e.g., deletion of completed forms once the data has been sent to the server). These measures will improve efficiency, ensure the quality of assessments, and enhance adherence to data governance.

Impact

  • Efficiency and Security Enhancements: Reduced ELOM’s data processing time by 185%, streamlining workflows from data collection to result communication. The system simplified form design, enabled real-time monitoring to improve quality control, and automatically generated visual reports after data processing. Encryption and access controls improved security, ensuring compliance with privacy regulations and providing stakeholders with secure, accessible insights.

ELOM impact

  • Improved Assessment Accuracy: Introduced color-coded instructions, hard-coded stop rules, and instructional videos, which increased the consistency and reliability of data collected by field assessors. These improvements minimized variability, reduced errors by 20%, and produced more accurate, actionable insights into child development outcomes—essential for informing early childhood strategies.

  • Cost-Effective Training: Transitioned field assessor retraining to an online e-learning platform, which enabled simultaneous nationwide training, reducing costs by 87%, and eliminating the need for team travel, making retraining more accessible and sustainable.


Thrive by Five
  • Scale Achievement: The redesigned ELOM data management system and user interface supported South Africa's largest national survey, Thrive by Five, which reached over 5,000 participants and represented approximately 600,000 children. The insights generated from this survey improved early learning programs and influenced national policy. For the full report please visit: Thrive By Five

  • Informed Strategic Investments: Enhanced data insights empowered Innovation Edge, the Department of Basic Education, and early learning programs to optimize investments and make evidence-based decisions, amplifying their impact and ensuring resources were directed toward the most effective initiatives.